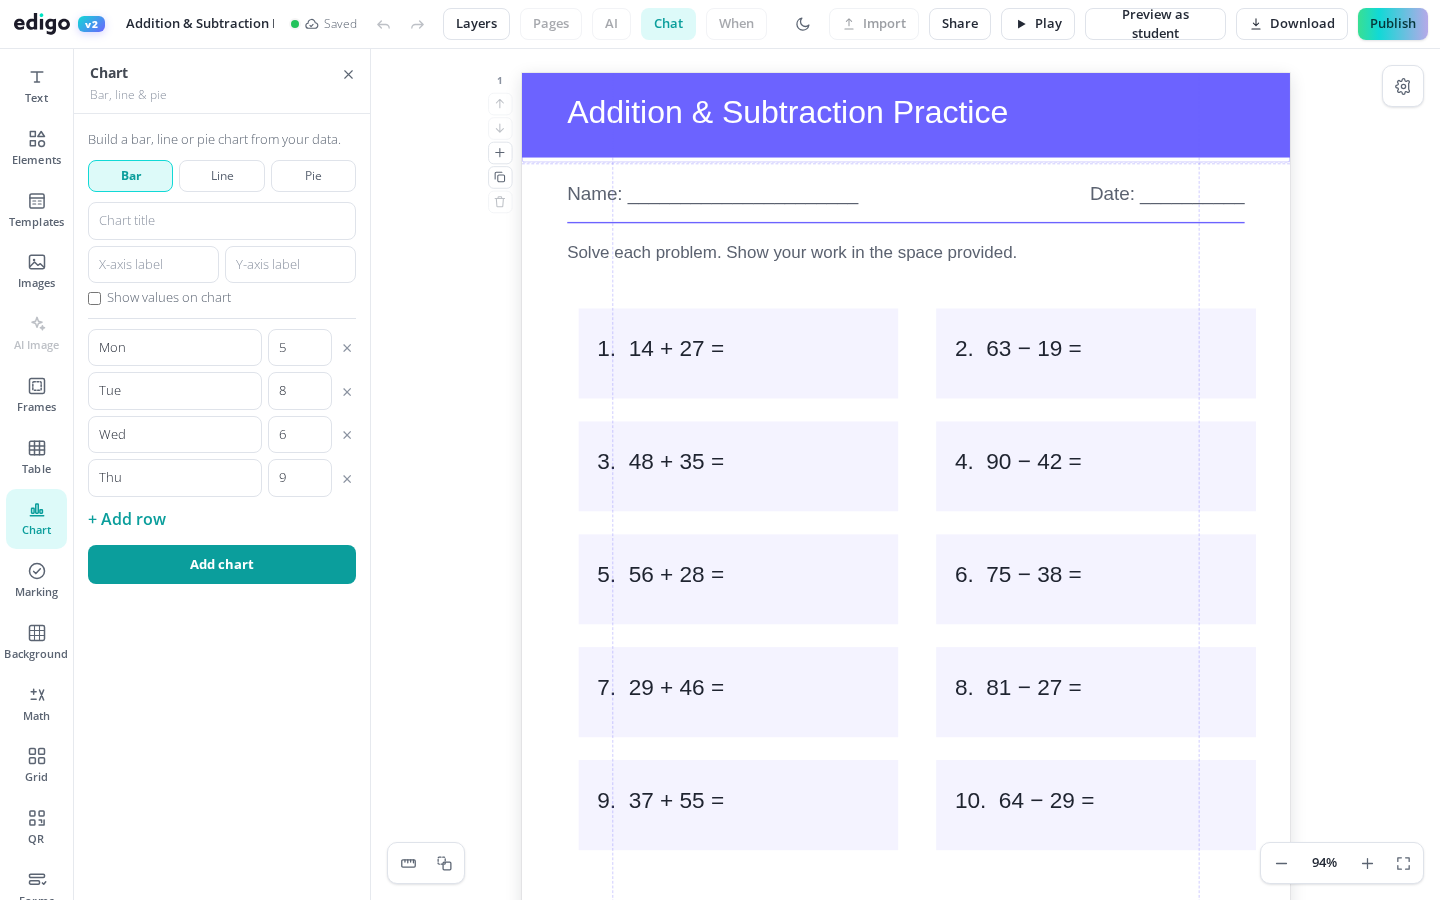
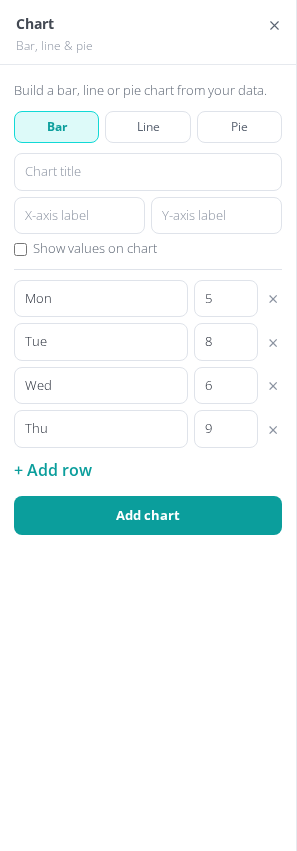
Edigo's chart maker for teachers lets you add bar, line and pie charts to any worksheet, poster or handout in seconds. Type your numbers into a simple table and watch the chart update instantly - no spreadsheets, no formulas, no exporting images. It runs free in your browser, so you can build a data lesson before the bell rings.
Choose bar, line or pie charts depending on what you are teaching. Compare test scores with bars, track a week of weather with lines, or show survey results as a pie.
No spreadsheet needed. Click the chart, type values and labels into a simple table, and the chart redraws itself immediately on the page in front of you.
Charts live right inside your design, so you can place one beside questions on a worksheet, in an infographic, or on a results display without switching tools.
Create examples for interpreting-data lessons, leave a chart half-labelled for pupils to finish, or display real class results so reading charts becomes something students do, not just watch.
Data handling clicks when the numbers belong to the class. With Edigo you can survey pupils in the morning, type the results into a chart at lunch, and hand out a worksheet built around their own answers by the afternoon. Because the data table stays editable, updating a chart for next year's class takes seconds rather than a rebuild.
Every chart is a design element, so you can resize it, recolour it and pair it with headings, images and question boxes. Make an eye-catching infographic for display, or keep things plain and printer-friendly for a homework sheet. The same chart works at any size, from a small task card to a wall poster.
Yes. The chart maker, like everything in Edigo, is completely free for teachers. Sign in, open a design and insert as many charts as your lesson needs.
No. You type numbers and labels straight into a small table inside the editor. The chart updates as you type, so there is nothing to import or export.
You can add bar charts, line charts and pie charts. That covers most primary and secondary data-handling topics, from favourite-fruit surveys to temperature graphs and fractions of a whole.
Yes. Charts are drawn as part of the page, so they stay crisp when you print or export, whether it is an A4 worksheet or a large classroom poster.
Join thousands of teachers using Edigo — free to start.
Start for free